
Most people live in parts of the world that experience extreme weather events at some point. It could be intense storms – with strong wind and heavy rain. Or blizzards. Perhaps fire and drought. Maybe flooding.
While you can’t ‘design’ your garden to handle all of these things, you can use your site analysis to handle some of them. And today I want to take you through an example of how to ‘over-engineer’ your garden design to cope with a specific event – in this case heavy rain.
In particular, I want to help you be able to ‘visualise’ what such an event looks like – and what it could do – to your current garden, and garden design ideas.
Before we look at that, a quick outline of site analysis.
What Is Site Analysis?
I cover site analysis in more detail elsewhere, but a quick summary will help. Site analysis refers to research you do about your property. It makes sense that before you drastically change something, you want to understand it.
I break it down into two parts – Macro conditions and Micro conditions.
Macro refers to weather and climate patterns. Things like wind, rain and temperature ranges – the averages and extreme outliers of these things. We also look at the extreme events we’re talking about here – storms, blizzards and other natural disasters.
Micro refers to the specific parts of your site. The ground conditions – your soil quality and type. Your site’s gradients, slopes, high and low points. Any council regulations or restrictions. And any surrounding things like existing buildings, walls, trees – anything that impacts your site.
Once you have this kind of information, you can use it to help you determine where the best positions are for particular activities or features in your design. Not only will your site analysis help with your design layout, but, as we will explore, it can help shape spaces to cope with these extreme outlier conditions.
Basically, I want to help you ‘visualise’ what an extreme event will look like in your garden. And how to ‘over-engineer’ your design to handle it.
‘Over-Engineering’ Using Site Analysis
I think of “over-engineering” as designing something to be able to handle certain extreme conditions. They’re often orders of magnitude higher than are currently realistic – or commonly expected. Civil engineers design bridges to withstand loads and other forces many times higher than have ever been experienced. This builds in a significant margin of safety, something vital when designing public roads.
So when we talk about over-engineering, we want to create a space that can cope with extreme events many times greater than normal. Building in a margin of safety across the whole garden design is ideal, but that can take time and effort that may have diminishing returns.
In this post we’ll explore extremely heavy rain – known as surface runoff – and how we can visualise what it would look like. Once you can ‘see’ that, it’s then easier to create solutions to try and manage such an event.
Pick Your Spots
I mentioned that trying to ‘over-engineer’ your entire yard may not be practical. It makes more sense to choose heavily affected areas and over engineer those.
With rain, these means we need to consider where rain will fall, and more importantly where it will flow and collect. To no-ones surprise, rain tends to flow downhill. We’ll touch on materials and how they impact things a little next, but for now, think about all the rain falling on your property as flowing towards your low point/s.
Focusing on these points of your site makes a lot of sense, at least to begin with. Once you understand the impact an extreme event can have on low points (in the case of heavy rain), you can adjust your garden design at higher points to help you manage it.
Use Site Analysis To Help Visualise The Worst Weather Conditions
I outlined above that site analysis covers macro and micro conditions. This attempt to visualise things is basically looking at how micro conditions influence how the macro impacts your site.
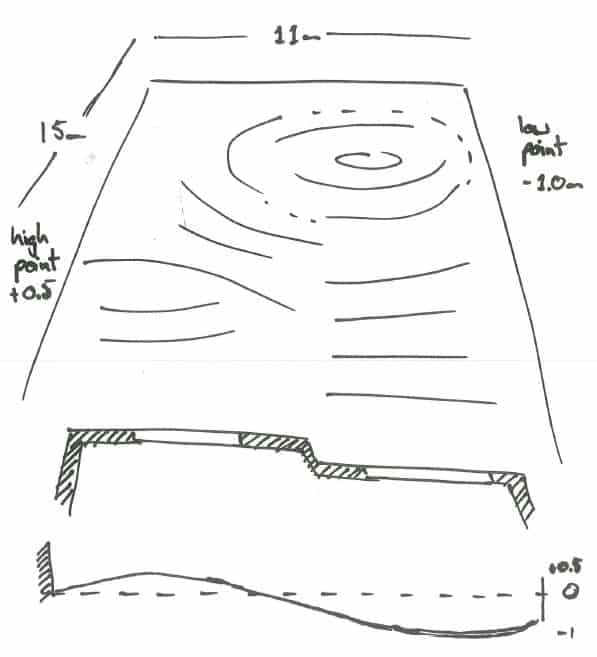
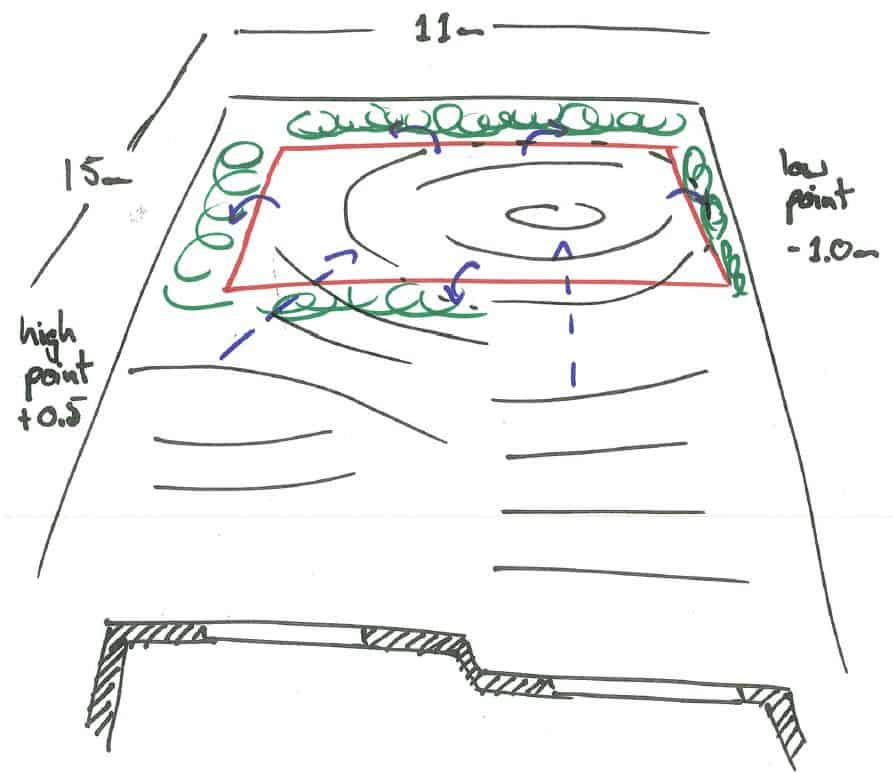
At the bottom is a simple rough section view showing the rise and fall across the site, using the house floor level as the 0 level.
Let’s have a look at a basic example. This drawing is extremely simple, but gives a rough idea of how the ground slopes. The low point is near the back corner of the yard, with the high point closer to the house. I haven’t added any existing elements, because we want to explore this as a blank canvas.
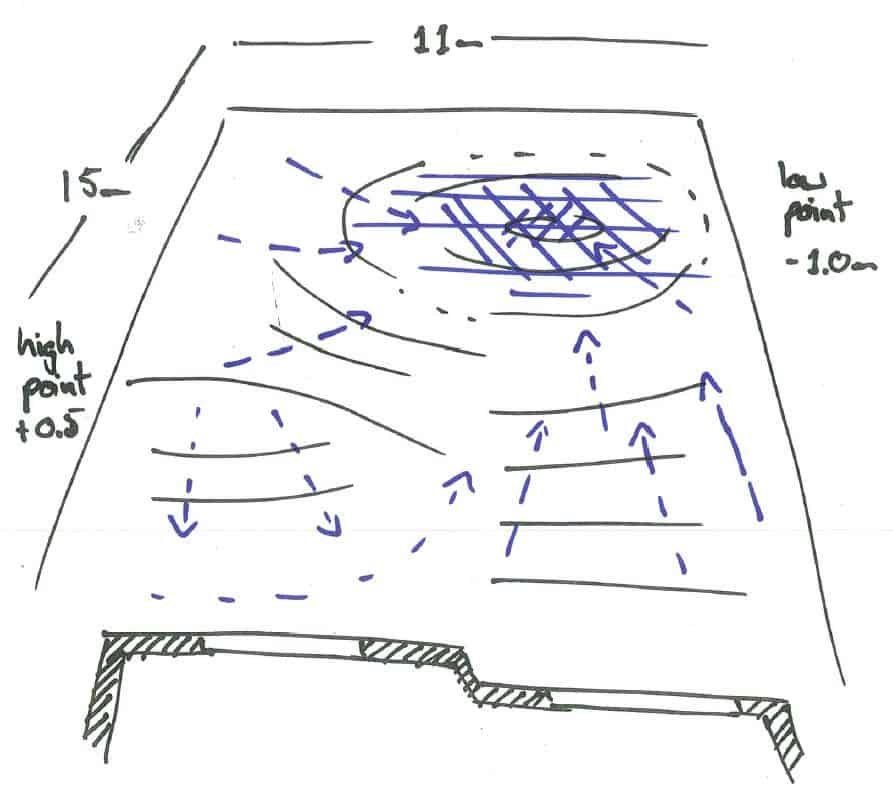
Drawing a quick overlay on top, I can show where I think (or hopefully, from experience, know) where water flows when it rains. Fences are not really barriers to rain, so we need to think about if rain from other neighbouring properties will also flow here. If yes, we need to over-engineer our design to cope with that additional water as well. For this example, I will stick to the backyard area only, just to simplify things.
Now that we have outlined what the ground looks like, we can calculate how heavy rain actually ‘looks’ when it falls here. Before I do that, let’s touch on materials and how they affect something like rain.
What Impacts Water Runoff?
Two main things influence how quickly water will flow or runoff from an area – the ground material, and the degree of the slope/gradient.
Different materials will absorb water at different rates. Hard surfaces – paving, concrete etc. – don’t absorb much, if any water – they ‘sheet’ it away, directing it somewhere else. They often have a ‘coefficient’ value of close to 1.0.
Softer surfaces – grass, sand, clay, soil, gravel etc. – will absorb water at different rates. They have coefficient values closer to 0 in general.
And the steeper the slope, the quicker water runs off – the less is able to be absorbed.
This link from The Clean Water Team Guidance Compendium for Watershed Monitoring and Assessment State Water Resources Control Board 5.1.3 FS-(RC) 2011 provides a useful fact sheet around water runoff. It includes the table below, showing coefficient values for different surfaces.
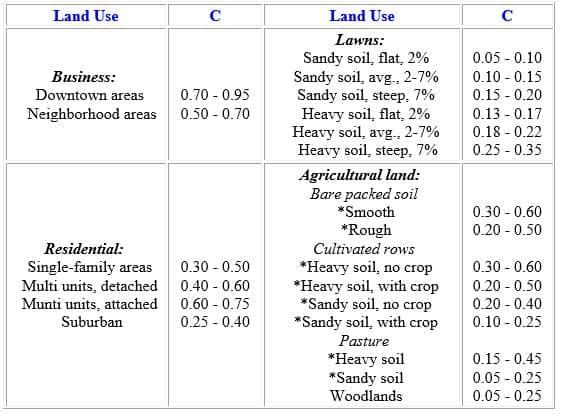
Land Use shows gradient percentages under Lawn, which gives you an idea of the different gradient makes to a material. Sandy Soil has a coefficient from 0.05 up to 0.2 depending on the gradient percentage.
How do you use these coefficients? As part of a calculation, often called the ‘rational method’. This page provides a useful calculator you can use to plug in some of the coefficients above. BUT… I have an easier way to approach this (more below), especially if you break up your site into different material/ land use options.
There are other resources you can Google for different materials like concrete or asphalt etc. but the above gives a useful point to start with. These coefficients are usually applied over large areas like suburbs – so your whole property would probably be classified as single-family area (0.30 – 0.50, or suburban (0.25 – 0.40). You can choose whatever land use option above makes most sense to you.
Calculating Surface Runoff
Let’s use some of the tools above – the coefficients and the calculator – to guess how much water would flow on our example site. To start, we need to state the area we are dealing with, and how much rain will be falling. Let’s use some figures I found during my site analysis research.
Ground Conditions – Area, Material, Gradient
Our made up example has a backyard area of 15 x 11 m = 165 m2. As I mentioned, let’s ignore the surrounding houses and properties for now, to keep things simple.
Although rain will also fall on the house, most houses have drainage set ups that collect rainwater, or direct it to council services like stormwater. So we’ll ignore it for now. If you don’t have that kind of setup, and water just collects on your property, you can add the building/s area to the calculation (just ensure your coefficient is high, as rooves are hard surfaces).
Another part of our site analysis is slope gradient. In our example, I’m going to suggest it is somewhat steep. A fall of about 1.5 m over a 10 m length = 15% gradient. If >7% is steep in this case, we definitely qualify.
So depending on which land use option we go with – for the 165 m2 backyard – we get the following:
| Suburban | 0.40 |
| Sandy Soil, steep, 7% | 0.2 |
| Heavy Soil, steep, 7% | 0.35 |
We’ll use these coefficients as part of the calculation, but we also need to get rainfall data.
Rainfall Volume
Rainfall data – monthly averages and extremes – are a core part of your site analysis. Hopefully your council or country has good records and historical data you can refer to. For me, BOM in Australia is an excellent resource. It shows averages and extremes.
Now we don’t really want to look at the average values – we want those 1 in 100, or even 1 in 1000 year events – the tail ends of the distribution.
For my home town of Melbourne, there is a 1% chance per year (or a 1 in 100 chance) of about 50 mm (2 inches) of rain falling in 1 hour. Technically this doesn’t mean it will only happen once in 100 years. In reality it will happen more frequently than that, but this is still a simple figure I can plug into our calculator.
Plugging Your Site Analysis Into The Calculator
So now that we have all the figures from our site analysis research, we can plug them into the calculator. For our backyard area – 165 m2 – and our rainfall volume – 50 mm/ hr – we get the following values for each material/ land use options:
| Land Use Option | Coefficient | m3/day | m3/hr ((m3/day)/24) |
| Suburban | 0.40 | 78.5454 | 3.27 m3 |
| Sandy Soil, steep, 7% | 0.20 | 39.2727 | 1.64 m3 |
| Heavy Soil, steep, 7% | 0.35 | 68.7272 | 2.86 m3 |
The Easier Way To Calculate Volumes…
Honestly, an easier way to calculate all of this instead of a calculator is to calculate it with a coefficient of 1, THEN apply the land use coefficient. Or just do the basic calculation – area x rainfall volume – then apply them.
So 0.05 (50 mm) x 165 m2 = 8.25 m3.
Multiply that by 0.40, 0.20 and 0.35 and you get 3.30 m3, 1.65 m3 and 2.89 m3 respectively. These slightly overestimate the volumes, but given the aim is to over-engineer, that builds in an extra margin of safety.
This is A LOT of water. Average bath tubs are around 200 L. If our ground has a coefficient of around 0.40, our volume is around 3300 L – or 16.5 bath tubs! Using a coefficient of 1 – 8.25 m3, or 8250 L – is equal to 41.25 bath tubs!
If this looks like too much math, don’t worry – the aim is to just get an idea of rainfall volume. If you want to simplify things, you can simply make every coefficient 1. This assumes all water that falls in your area will flow to the low point. And builds in an even greater margin of safety into your design.
Great! But What Does This Amount of Water Look Like?
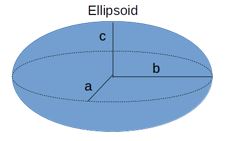
Next step is to look back at our basic drawing again. My measurements of our low point suggest a space about 8 m long by 3 m wide. It’s an oval, elliptical kind of shape, so I’m going to use an ellipsoid volume calculator to try and roughly estimate our water depth. Part of this will involve guessing the height (semi-axis c) until the volume matches our calculations above. This won’t exactly match our ground, but that’s fine.
It is a little tricky, because the calculator determines the whole volume of our ellipsoid. We only really want the bottom half, as it is closer to our ground conditions. So if we want the bottom half to equal our rainwater volume, we need to get our calculator to return a volume result double that.
In our case, if I want to figure out 8.25 m3 (pretending our whole backyard is a hard surface), I need to get the calculator to return a volume of double that – or 16.5 m3.
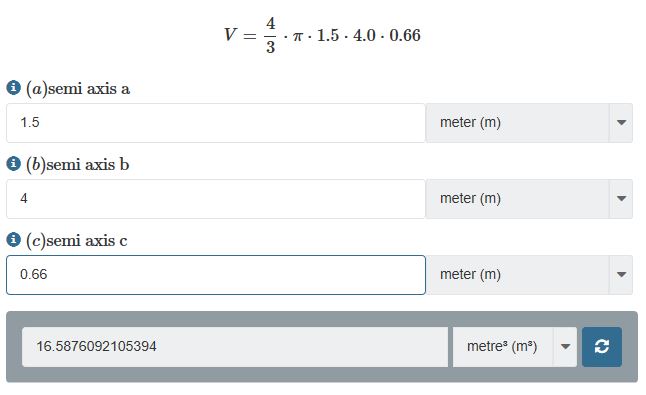
Guessing a few different heights (from 1 m height radius, working down) gives me a 0.66 m high radius = 16.59 m3.
If you look at the image above, pretend ‘c’ is the actual height we want. So not a radius, but the full depth.
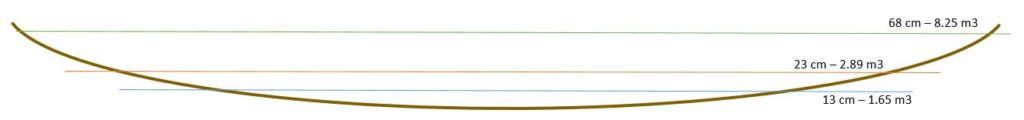
All of this finicky work suggests that if we had 50 mm of rain fall within 1 hour, all over our backyard of 165 m2 – all of it concrete, or paving, or asphalt (something with a coefficient of 1) – and it ALL flowed to the low point, this area would fill up to a depth of about 66 cm (or 26 inches – over 2 feet)!
If we had different ground materials, such as heavy or sandy soil, that height would drop accordingly – 23 cm and 13 cm respectively, if I attempt to hit their corresponding cubic volumes into the calculator. This is a lot easier to manage, but still a substantial volume of water.
So this kind of calculating work gives us a rough idea of what kind of water flow and collection we’d be dealing with. And this is only in 1 hour. If the storm lasted at this intensity, we’d get even more water! That said, it’s unlikely to experience this intensity for multiple hours.
So know that we have a ‘visual’ of what this could look like, let’s look now at how we can use this information – this site analysis – as part of our design process
So How Do We Over-Engineer To Cope With This?
Considering how we deal with this extreme event touches on a few parts of the landscape design process.
- Deciding what activities, features or other garden ideas work well (or not) in this position
- Work out what materials these spaces are likely to use, and how suitable they will be for these kinds of extreme conditions
- Shaping the materials and components for these activities etc. to manage varying levels of inundation – to respond to our site analysis research
You may find you can place a number of activities, feature or garden ideas in this position. And they each have different material and layout options. Let’s look at two common activities/ features – an entertaining space (with surrounding garden beds/ screening plants) and feature garden beds (larger beds with feature plantings). We’ll explore how this specific piece of site analysis can influence how this space is designed.
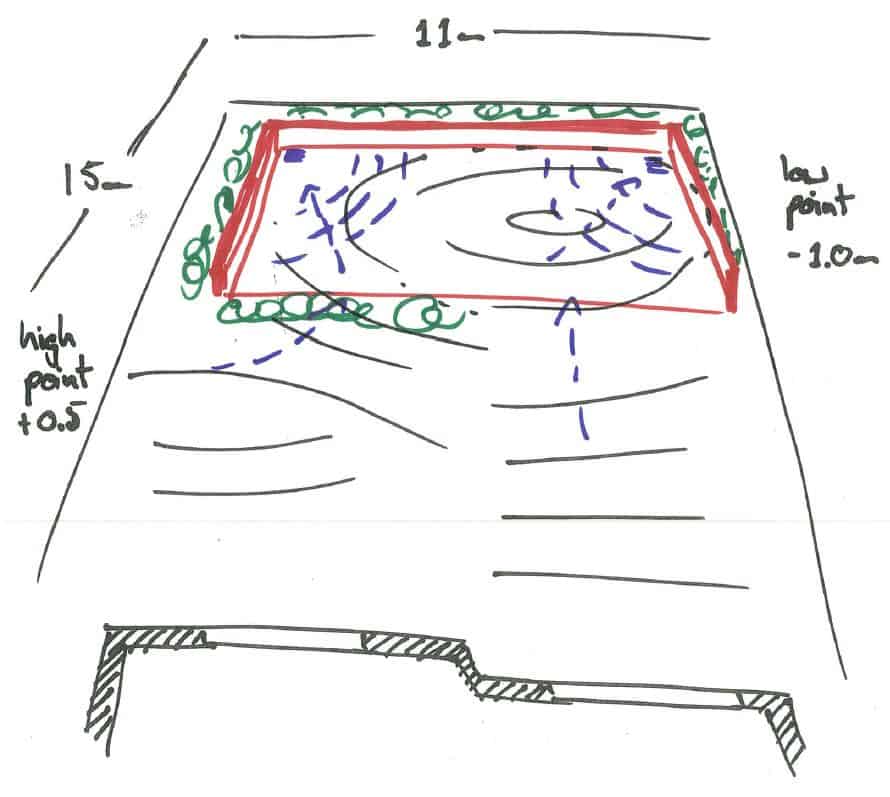
Entertaining Space
Rather than a full ‘dining’ space, I will pretend this is more informal – a space to relax and lounge. That said, it will contain hard materials – paving, brick, concrete – something like that. And we’ll make this space a similar sized rectangle – say 9 x 4 m, set a little off the fences.
Now we know that these materials won’t absorb water, so if it flows to this point, how would we deal with it? Let’s look at some different layouts, and how we could try to manage a large influx of water from this storm.
This version is a simple flat surface. Given it’s a hard surface, you’d want to ensure good drainage – both where the points are, the pipe size, and where it connects to. Do you connect to stormwater? Or your own water tank?
Another thing to note here is that a lot of the water would not collect in your drains. It’s likely it would pool around the space, into surrounding garden beds. If that is part the plan – to cope with some runoff – you’d need to consider suitable plants in these spaces (and their own drainage requirements). You could add some suitable plants around all sides, making them more of a feature of the space as well.
What if you had a low bench/ wall around three sides? This could reduce the impact to the garden beds near the fences. However, you may need to collect more water, and push it into other surrounding areas. This means your drains and pipes might need to be a little larger to compensate. To ensure the sitting water can drain away in a timely manner.
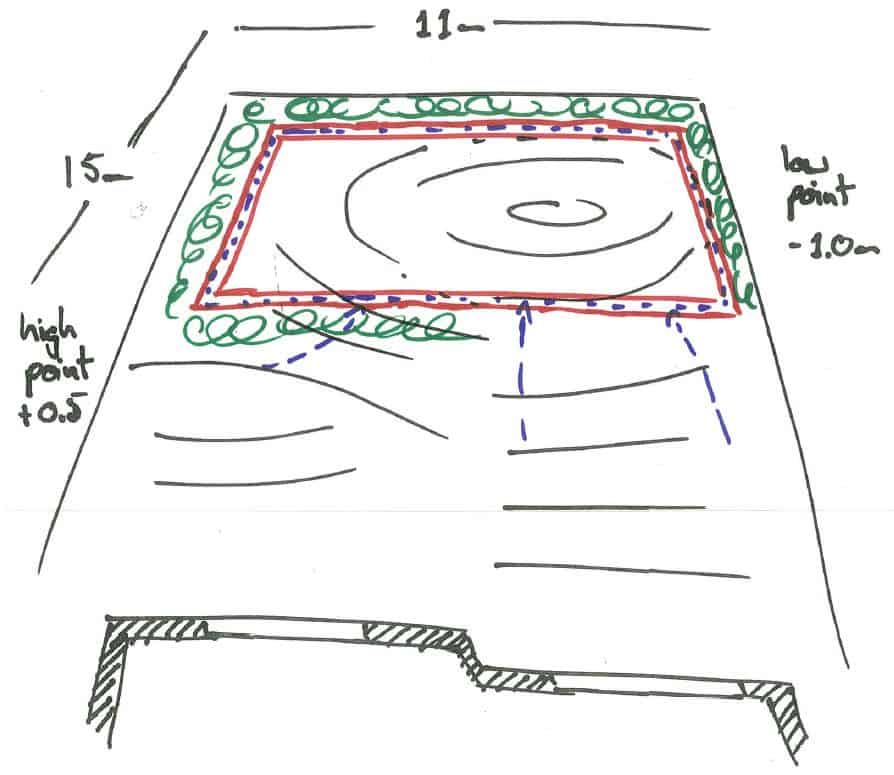
Another option may be to highlight the ‘issue’ of having a hard surface at your sites lowest point and show the drainage element by way of a small surrounding moat or large drain.
This means you don’t have drainage points in your entertaining space, but rather in the guttering around the edges. Or maybe you make it wide or deep enough to collect and hold rain. So it becomes something of a temporal feature, a periodic water feature. You’d still need to provide overflow points, but you could discuss with an expert how to deal with that.
Other options may be you choose hard materials that at engineered to withstand this kind of inundation. I wouldn’t recommend it in this case – as this is an extreme outlier event – but it could be a way you approach this.
Remember, you don’t need to know the specific answers now – or how all this would actually work. Once again, being aware of these considerations – and asking an expert later on – is more than many people will do.
Expert involvement with all of the ideas above would be ideal, but you’re the one bringing the ideas to the table. Asking specific questions to get specific answers. The best way to use an experts time.
Feature Garden Beds
Perhaps, as part of our design process, we decided this low point of the site is unsuitable for an entertaining area. As we’ve seen above, it’s possible to place one here, but it requires over-engineering to cope with these extreme events. Having looked at that, we think it’s not worth the cost. So we opt for something more robust – a feature garden bed.
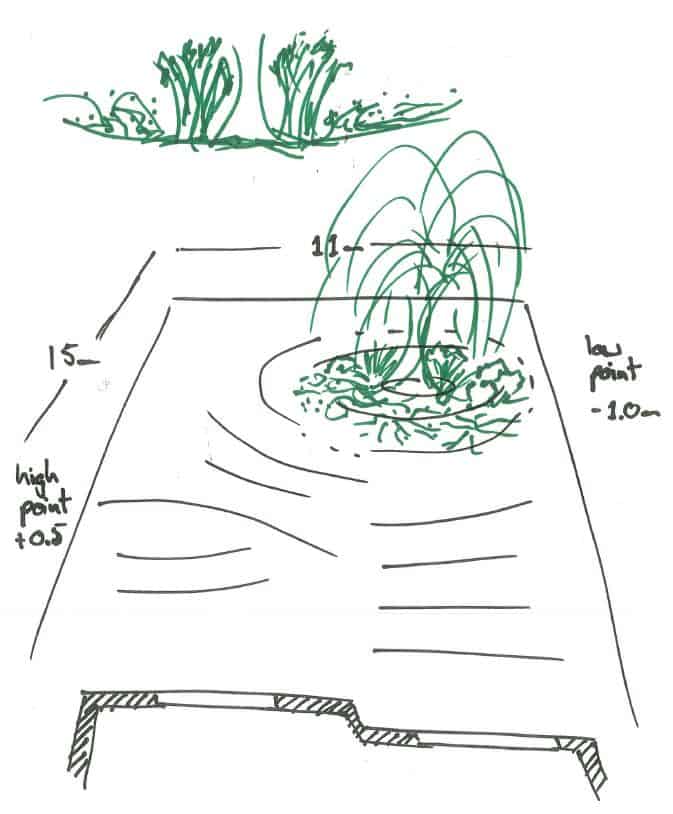
Here could be an interesting opportunity to try and use plants that can cope with these kinds of extreme conditions. Find plants and trees that are able to cope with inundation, but don’t rely on it. You could keep the ground as it is, and plant it out with some suitable options toward the bottom of the slope.
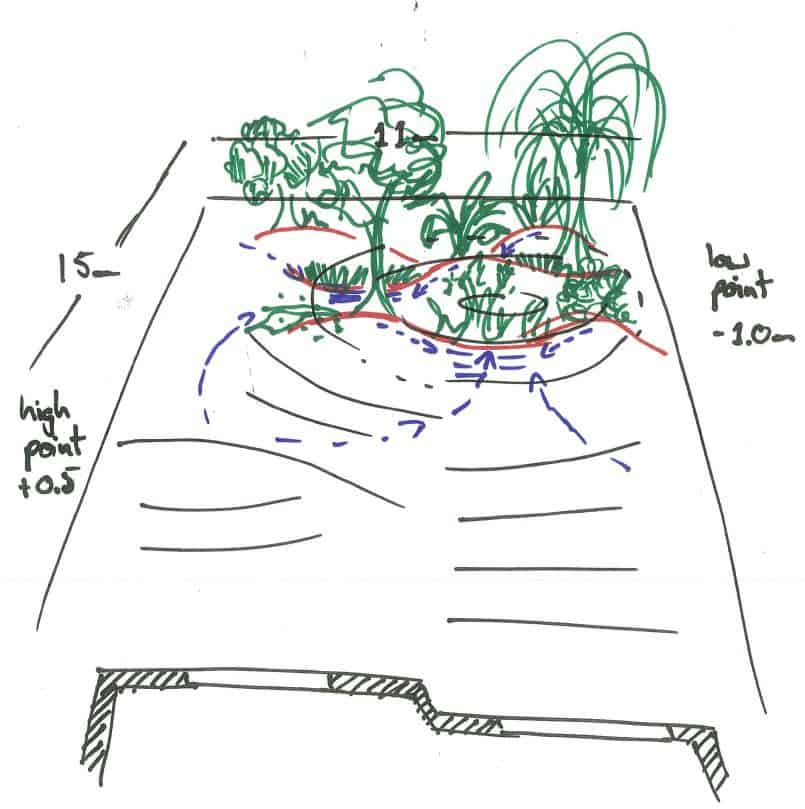
Or, you could look to actually alter the ground itself – changing it to have a series of hills and hollows. This means you may have more scope to include plants that don’t deal with inundation that well. Plant those on the higher hills, and put suitable plantings in the lower hollows. This way you can mix and match different plants, offering more variety.
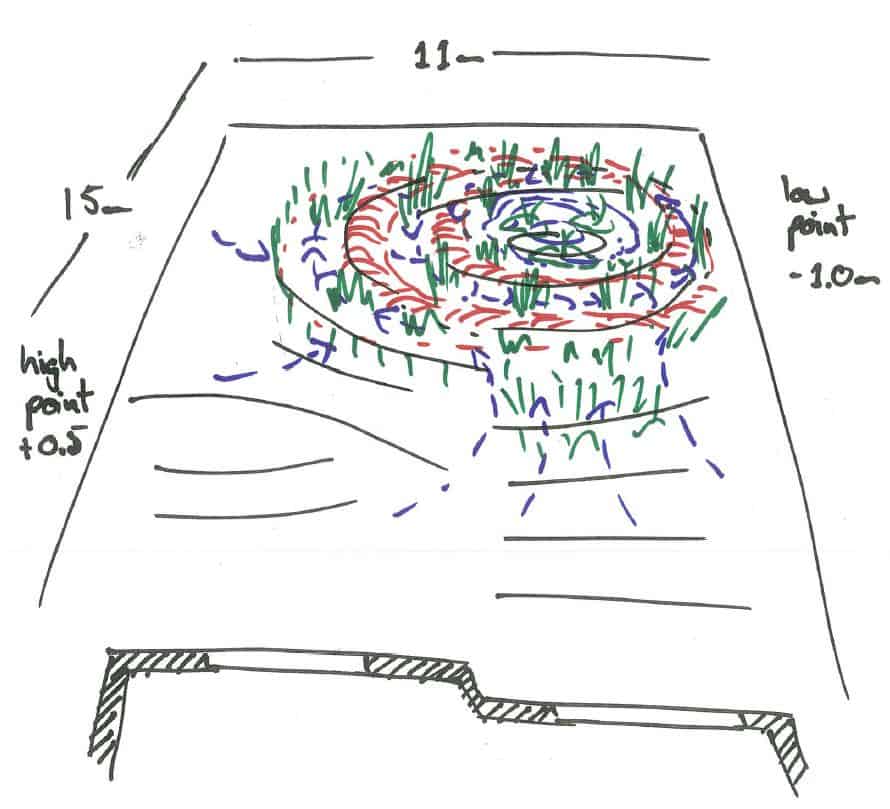
If you really wanted to embrace the water collection possibilities you could opt for a small wetlands type set up. Plants that can help collect, clean and filter the water before you store it. Maybe you ‘lean in’ to the negative aspects of the low point, and make them a positive.
Conclusion
Hopefully this little exploration gives you an idea of how understanding your site and weather conditions – your site analysis – can have a really interesting impact on how you design these spaces. As we’ve seen
Again, you don’t need to know all the answers to these ‘questions’. But having an idea of what an extreme event could ‘look’ like, and being able to articulate that, will help. If you talk to experts, you can mention the research you’ve done, and ask about common strategies to handle extremes.
Once you come up with a few designs for a similar position, you can design them to accommodate these extreme events. This is why I preach the importance of undertaking site analysis. As you’ve seen, it can help you shape your designs to take this knowledge into consideration.
Remember this approach when it comes to your own design work. Extreme conditions – the tail of the distribution – can have a bigger impact on your design ideas than the average. Keep that in mind.